Plasmid sample preparation
- Prepare samples at 50 ng/μL in 10 μL of nuclease-free water or low TE buffer.
- Submit samples in 96-well PCR plates or in tube strips with the number indicating the sample number of each strip. Do not use 1.5 mL centrifuge tubes or screw cap tubes as these will not be processed.
- We do not routinely recommend Fluorometric Quantification (e.g. Qubit) because this is impractical in most settings. This does mean that when you start using our service your samples might not sequence well at what you measure to be 50 ng/μL, however, by tuning the concentration you will be able to determine a concentration that works for your setup.
How does plasmid sequencing work?
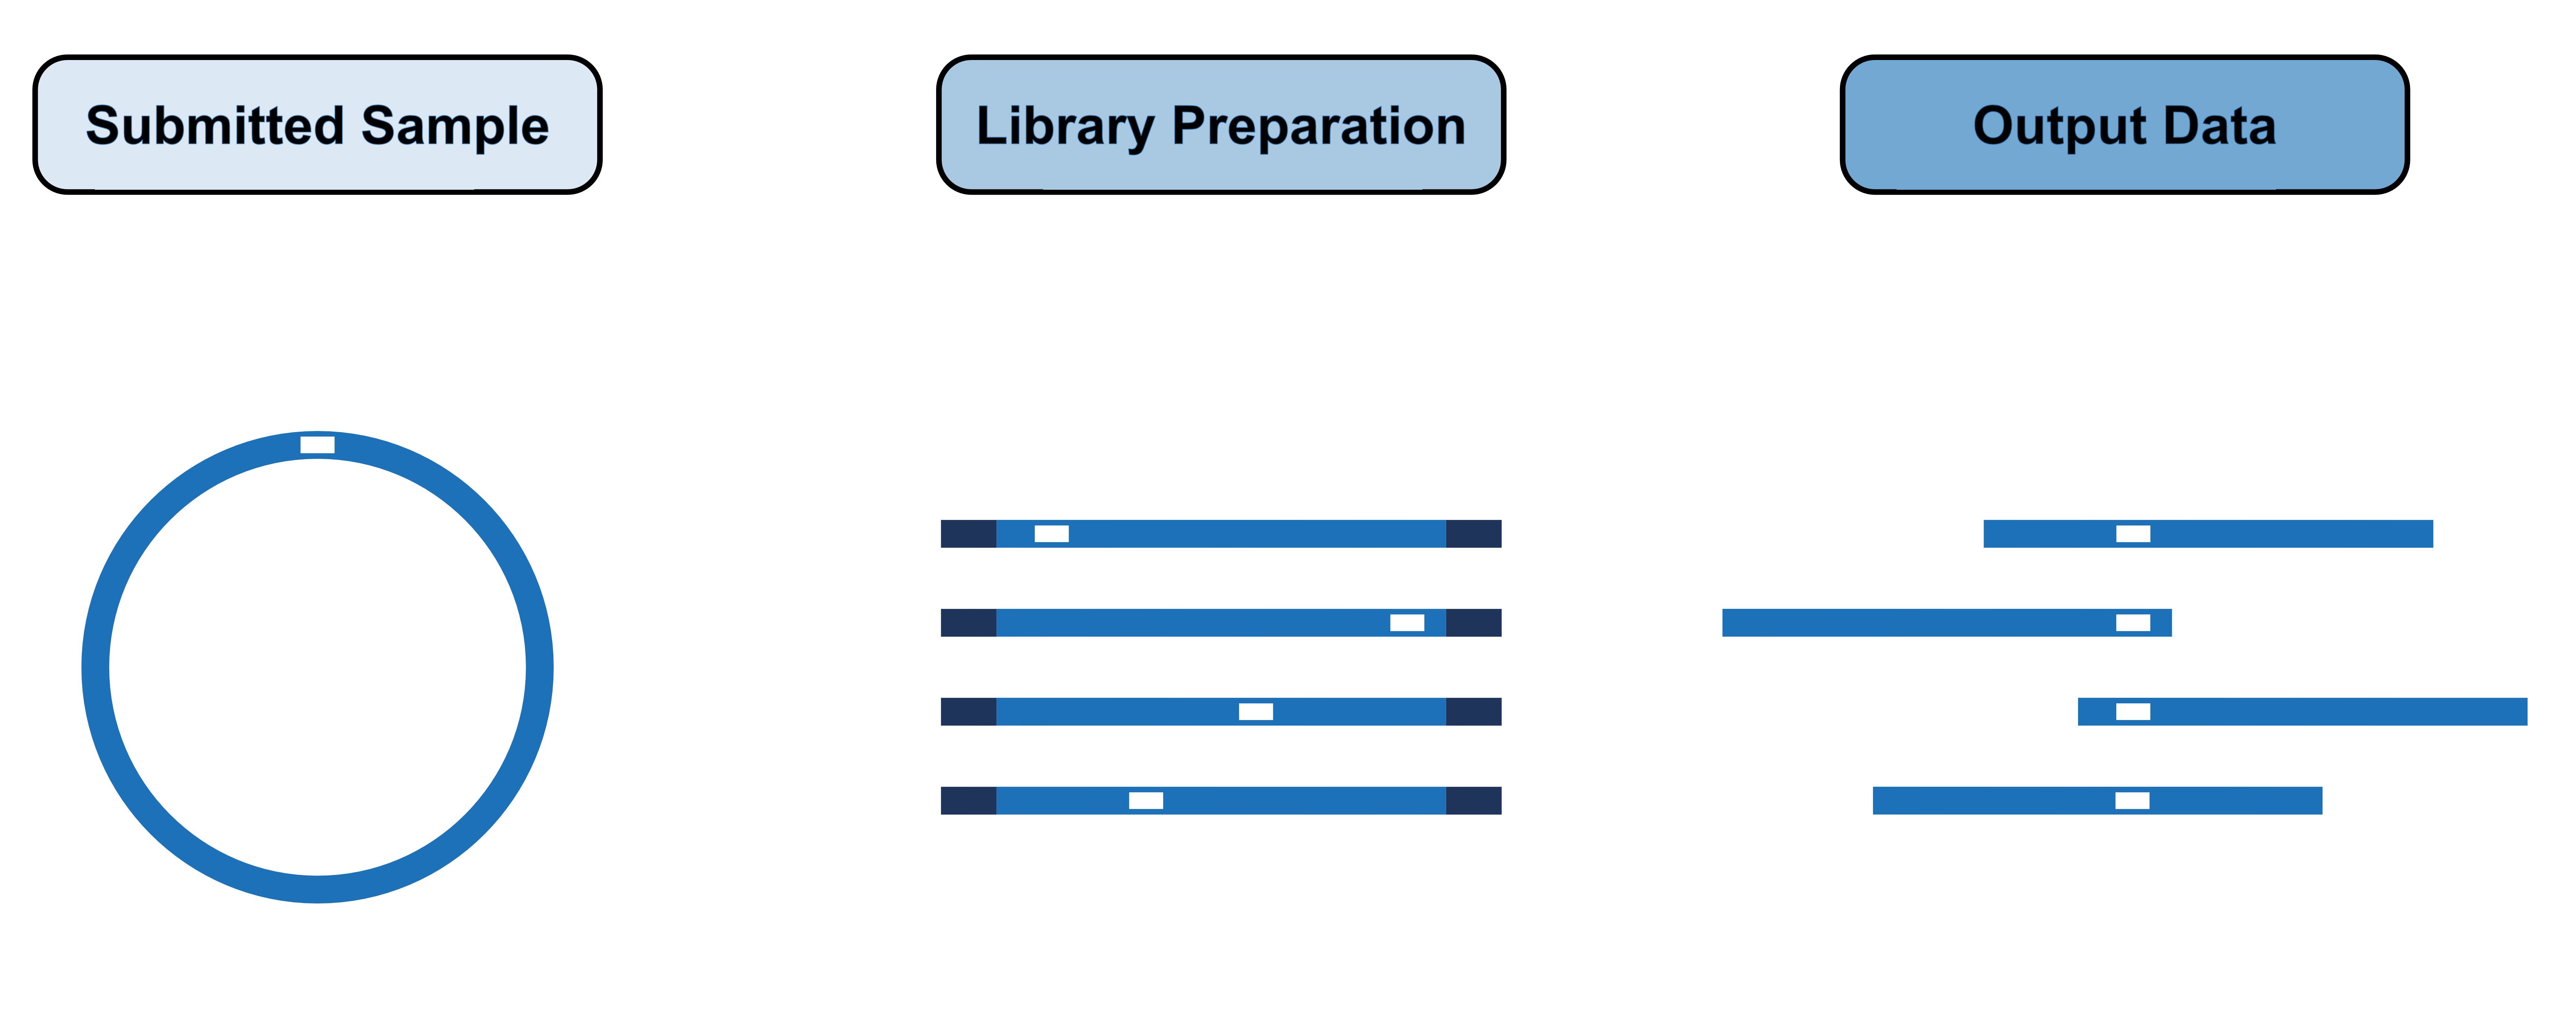
During the library preparation of your plasmid samples the plasmids are linearised at random positions around their circumference and these linear fragments are then sequenced. We then run these sequencing reads through our assembly pipeline.
What files do we provide as part of the results?
- Assembled plasmid file (.final.fasta)
- Confidence of assembly file (.confidence.fasta) which converts lower confidence bases (<Q20) to lower case, for easy interpretation when aligning sequences. Thanks to Oscar from the Crick for suggesting his tool called plasmidsaurus_helper.
- Annotated genbank file and html plot (.final_pLann.html and .final_pLann.gbk)
- Raw basecalled sequencing data (_raw.fastq.gz)
- Length and quality plots for your raw reads (_length.png and _qual.png)
- Statistics file used to generate the length and quality plots (.stats)
- As a final check we align the raw basecalled reads against your assembled plasmid file and provide a file that shows the proportion of bases that correspond to the assembled plasmid fasta by position (_alignment.csv). We place potentially problematic positions at the top of this file (where the proportion corresponds to less than 80% of the total number of reads covering that position. We also provide a visual representation of this data (_bam_alignment.png) and a format compatible with bioinformatics software to quickly visualise the quality (.fastq).
